Laser-cut lake depth maps: turn the water upside down
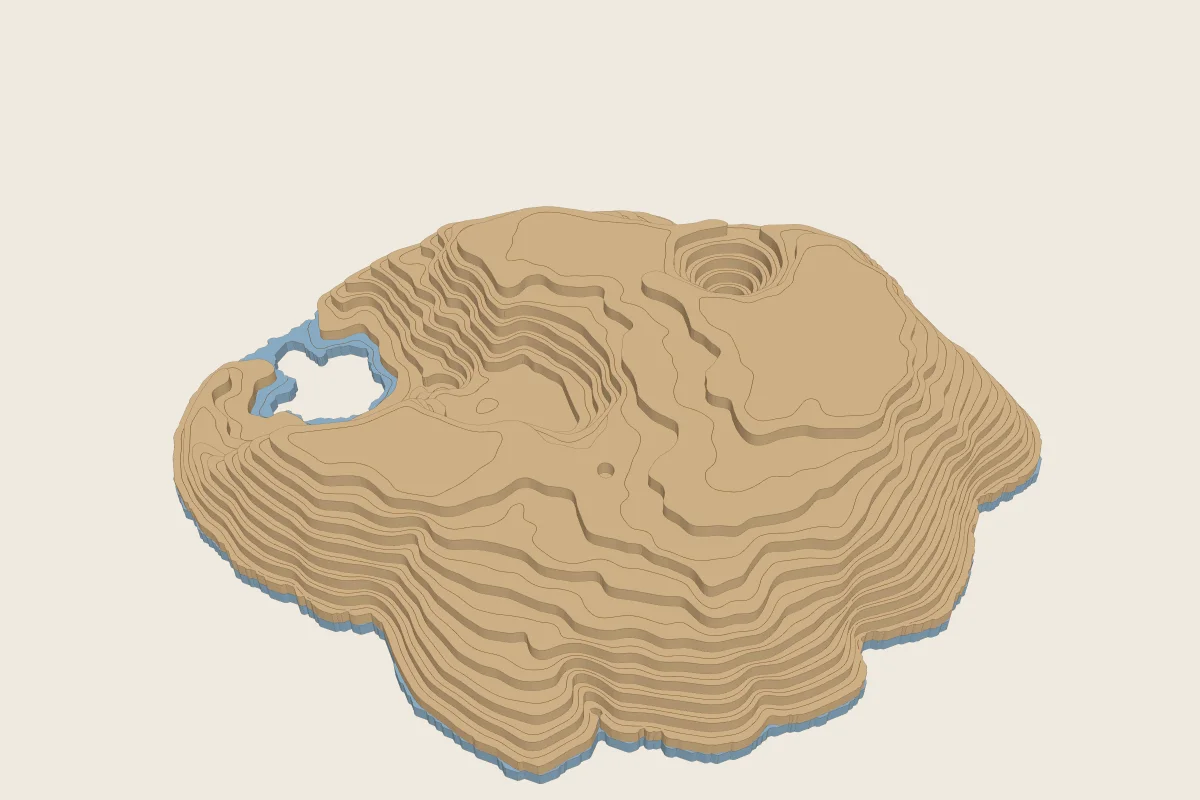
A layered relief map is usually a mountain. Turn the idea over and it works for water too: a lake cut into sheets, one per depth step, with the shoreline at the bottom and the deepest point as the tallest layer. You are holding a cast of the water itself. Underwater volcanoes become pits, islands become holes, and the flat floor of the deepest basin is a plateau on top. Few people make these, and they are easier than they look: the relief map generator does it with one setting, Dark is high.
This post covers where to get depth data for lakes and seas (more of it is free than you would expect), how to turn it into a heightmap with a short script, and the settings, worked through for Crater Lake in Oregon, the deepest lake in the United States. A second example does the same for Lake Baikal from global seabed data.
Two ways to cut a lake
There are two ways to make a lake into layers, and they need different data.
- The cast (this post's main example). Only the water: the map has the lake's shape, the shore is the base sheet and every layer above it is deeper water. You need depth data for the lake and nothing else. In the generator: Dark is high on, Shape = outline.
- The basin. The lake floor in the land around it, the normal way up: the lake is a hollow in the hills, and the deepest point is the base. You need the depth data and a land elevation model, joined into one heightmap. In the generator: the defaults.
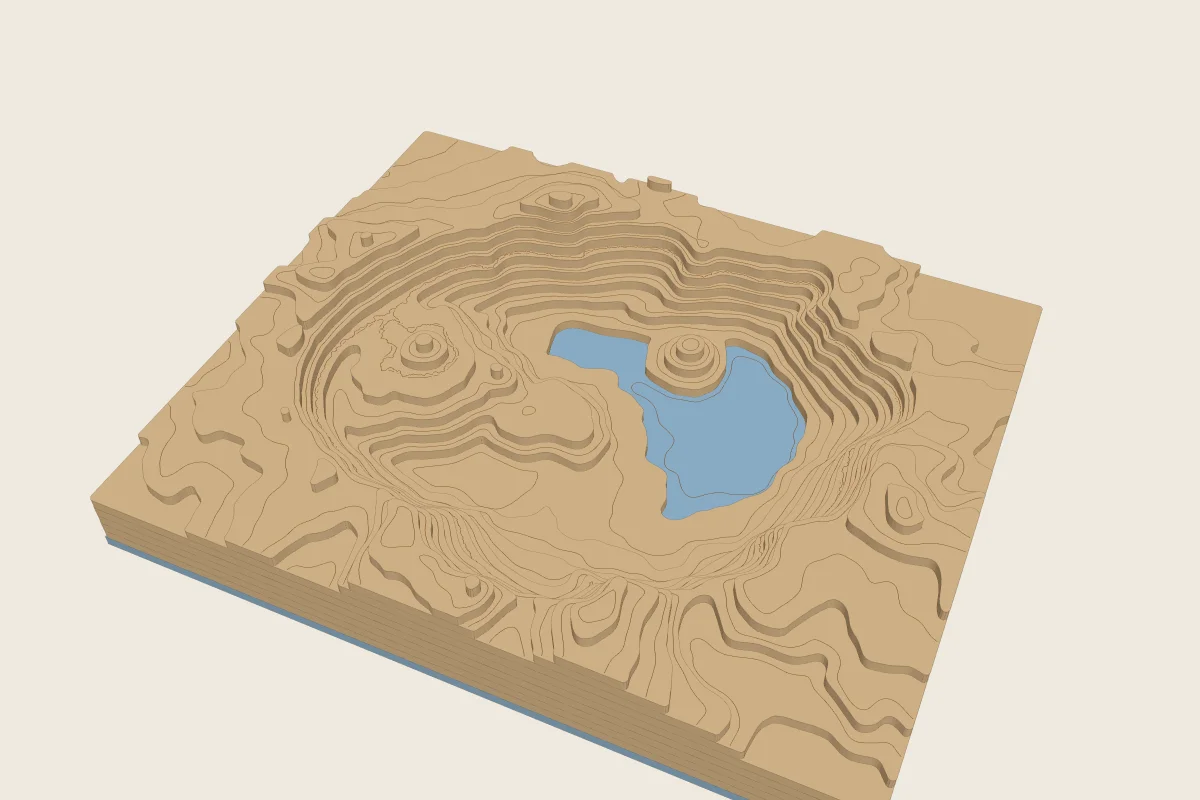
The basin is what the place looks like with the water drained, and the caldera rim makes a handsome map. But the water is the reason you chose the lake, and in the basin it is invisible: the blue patch above is not the water, it is the base sheet showing where the floor is more than 530 m down. The cast is the stranger and more striking object, and it is the one only depth data can give you. Most of this post is about the cast; the basin is at the end.
What Dark is high does
The generator reads a greyscale heightmap with light as high. Depth data comes in two forms:
- Heights (most surveys and all global grids): the lake floor as metres above sea level, or the seabed as negative numbers (−4,000 m). Saved as a picture, deep water is dark.
- Depths: positive numbers going down (Minnesota's lake maps store depth as negative feet; nautical charts give positive depths). Saved as a picture, deep water is light.
For a cast you want the deepest water as the tallest layer. With heights, that means dark is high: tick it, and the generator flips the greys before anything else. With positive depths, the picture is already light where it is deep, so leave it off. If you are not sure, load the file and look at the 3D preview: if the shoreline is the top layer, flip the setting.
The second ingredient is transparency. Transparent pixels are off the map, and with Shape set to outline the map takes the shape of the opaque ones. So a heightmap with the land made transparent cuts out as the lake, and an island in it becomes a hole through every sheet.
Where to get depth data
| Source | What | Detail | Licence | Get it |
|---|---|---|---|---|
| GEBCO | Every ocean and sea, plus the biggest lakes (Baikal is in it) | 15 arc-seconds, about 450 m | Public domain; credit GEBCO; not for navigation | download.gebco.net (pick an area), or the whole grid as one GeoTIFF (below) |
| EMODnet Bathymetry | European seas | 1/16 arc-minute, about 115 m | Free to download; check the licence on the portal | emodnet.ec.europa.eu |
| NOAA NCEI | The Great Lakes and US coasts | Great Lakes about 90 m; coastal models much finer | US public domain | Great Lakes bathymetry, bathymetry viewer |
| USGS surveys | Individual lakes surveyed by sonar: Crater Lake (2000), Lake Tahoe (1998) and more | Metres | US public domain; credit USGS | Crater Lake, DS 72, Lake Tahoe |
| Minnesota DNR | About 1,900 Minnesota lakes | 5 m (some 10 m), depth in negative feet | No use constraints listed | Minnesota Geospatial Commons |
| swissBATHY3D | Swiss lakes (Geneva, Constance, Lucerne, Zurich...) | 1 m tiles, ±0.5 m | Open data with swisstopo credited | swisstopo |
Elsewhere, search for your country's environment or water agency and "lake bathymetry" or "lake depth map". Many publish their lake surveys, but often only as contour maps: lines of equal depth, not a grid. Those can be turned into a grid in QGIS (Raster > Analysis has interpolation tools, or the TIN interpolation algorithm), but it is an afternoon's work. For Scotland, Murray and Pullar's Bathymetrical Survey of the Fresh-Water Lochs (1897-1909) is free to browse at the National Library of Scotland, Loch Ness included; I did not find a free grid of Loch Ness or of Lake Bled.
How much detail you need follows the same rule as on land: the generator keeps at most 300 cells along the map's long side, so a lake 9 km across needs 30 m data, and a sea 500 km across is fine with GEBCO's 450 m. Most lake surveys are much finer than that; the script averages them down. (More in where to get a heightmap.)
Crater Lake, step by step
Crater Lake fills the caldera left when Mount Mazama, a Cascade volcano, erupted and collapsed about 7,700 years ago. It is 594 m deep, the deepest lake in the United States. After the collapse, smaller eruptions on the caldera floor built volcanoes while the lake was filling: Wizard Island, the one cinder cone tall enough to stand above the water today, and Merriam Cone, which never reached the surface. The USGS mapped the whole floor with a multibeam sonar in the summer of 2000, and the data is public domain.
What comes out is a 200 × 178 mm cast of the lake: 1 base sheet and 10 layers of 3 mm plywood, 33 mm tall. The map is 1:46,500, and the depth is stretched 2.4 times, so each sheet stands for 59 m of water.
Step 1: Get the survey
The 2000 survey is USGS Data Series 72. Download the
ArcInfo GRID bathymetry, bathy.tgz (37 MB), and unpack it twice (it is a .tar inside a .tgz):
curl -O https://pubs.usgs.gov/dds/dds-72/data/bathy.tgz
tar xzf bathy.tgz && tar xf bathy.tar        # -> bathy/bathyg/, the grid
It is a grid of 2 m cells in UTM zone 10 (metres, so the pixels are already square), 4,677 × 4,137 of them. The values are heights of the lake floor above sea level, from 1,289 m at the deepest to 1,881 m at the shore; the water surface was at 1,882.6 m during the survey. Land and Wizard Island have no data.
Step 2: Make the heightmap
bathymetry.py turns a grid like this into what the generator wants: a 16-bit PNG,
black at the lowest point and white at the highest, cropped to the water, with the cells that have no data
transparent. It reprojects latitude/longitude grids to UTM on the way and averages the 2 m cells down to 900
pixels across (the generator keeps 300 cells, so 900 divides evenly).
pip install rasterio numpy shapely
python bathymetry.py bathy/bathyg crater-lake.png
# 900 x 801 px of 10.3 m (9.30 x 8.28 km), black = 1289.1, white = 1880.9, 31% transparent
Or take the result, crater-lake.png, and skip to step 3.
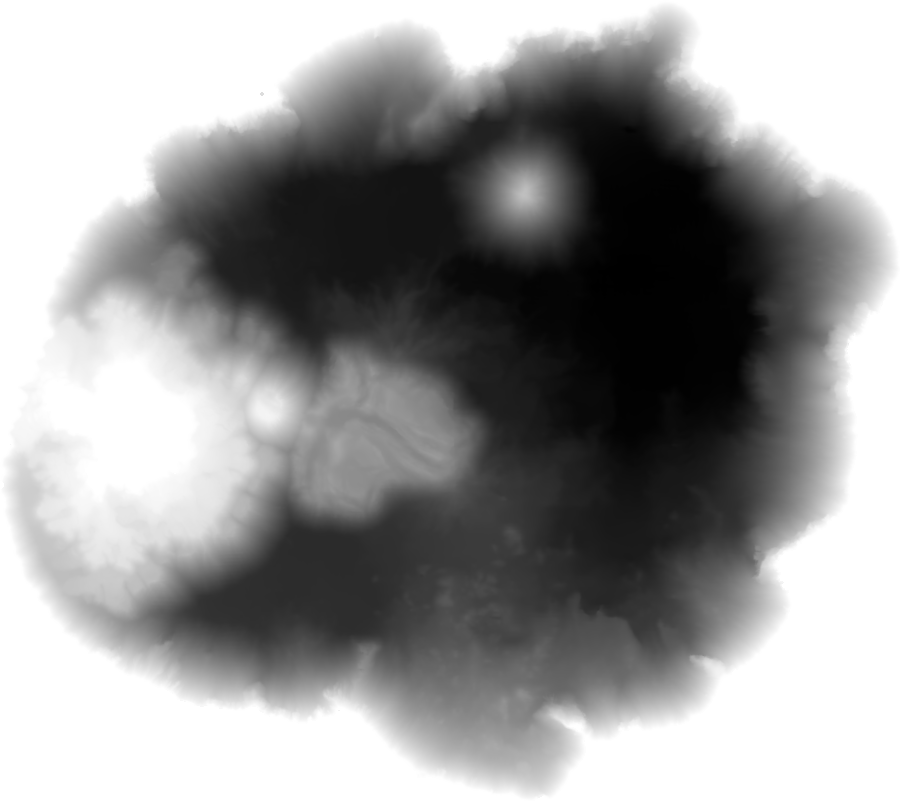
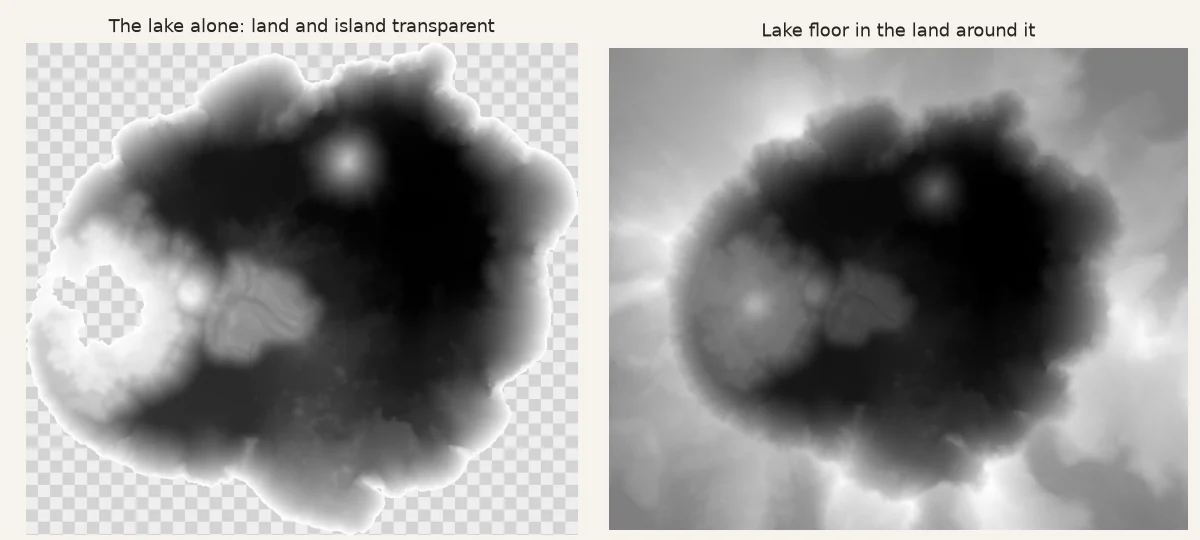
The left one is the cast's heightmap. The deep basins are black, the shallow shelf around Wizard Island (the transparent hole on the left) is light, and the bright spot near the top is Merriam Cone, its summit much nearer the surface than the floor around it.
If you make the PNG in QGIS or GDAL instead, make sure the transparency is an alpha channel. GDAL's PNG export can mark "no data" as a single transparent grey value instead, which the generator does not read: those pixels then count as part of the map, usually as its lowest point, and with Dark is high the land becomes the tallest layer. The script writes an alpha channel.
Step 3: Set up the generator
Open the Relief map generator, load crater-lake.png as Heightmap or 3D model, and set:
| Setting | Value | Why |
|---|---|---|
| Dark is high | on | The deepest water is darkest; this makes it the tallest layer. |
| Map size | 200 mm | The long side: 9.3 km on 200 mm is 1:46,500. |
| Relief height | 30 mm | 10 sheets of 3 mm for 593 m of water. At true scale the lake would be 12.7 mm deep; 2.4 times is enough to read the floor without turning it into spikes. |
| Sea level | 0 % | Nothing to flatten: the shore is already the lowest ground. |
| Shape | outline | The map takes the lake's shape (its opaque pixels). |
| Base sheets | 1 | A solid sheet the shape of the lake, the water's surface. |
| Smallest feature | 2 mm | The default. |
| Smoothing | 1 mm | The default. |
| Contour lines per layer | 1 | A line half way up each step, at the depth between two sheets. |
| Alignment pins | 2 | Hidden pins in blind holes (here 30 mm and 27 mm of 3 mm skewer). |
Step 4: Read the preview
Each layer is the water deeper than a certain depth: L1 is everything deeper than 31 m (almost the whole lake: the caldera walls go straight down), L5 deeper than 268 m, and L10, the top, deeper than 564 m. Things to look for:
- Wizard Island is a hole through every sheet, on the left. The shallow platform around it is the low ground of the cast.
- Merriam Cone is a pit near the top: a volcano rising from the floor is water that isn't there, so on the cast it is a crater sunk into the plateau.
- The top is flat. The deepest basins are flat because they are filled with sediment washed and slid down from the walls (up to about 100 m of it in the east basin, by the USGS's account). The top sheet, L10, is the floor of the east basin.
- Ten relief layers and no note about layers left out at the top; a green No parts overlap in 3D.
If the shore comes out as the top layer, Dark is high is the wrong way round for your data. If the cast looks like a flat slab with a few steps on top, raise Relief height: a lake is far wider than it is deep, and most need exaggerating more than a mountain does.
Step 5: Cut and assemble
Download the sheets, cut and glue them as for any relief map (the K2 post walks through it in its step 5): pins into the base, then the layers in label order, each on the outline engraved on the one below.
A cast reads best when it does not look like a mountain. Some ideas:
- Paint it like water: pale blue at the shore going to a deep blue on the top sheet, the colours of a depth chart. Paint the loose sheets before gluing.
- Cut the base from clear or blue acrylic, so the water's surface is the one transparent sheet.
- Engrave the depths: the generator's markings file takes an SVG with text converted to paths, so the depth of each sheet, the lake's name and "594 m" can go on the flat top (see the K2 post's step 3 for drawing one that lines up).
A big lake from GEBCO: Lake Baikal
For a sea or a very large lake, GEBCO's global grid is the source. It is land and water in one grid, heights above sea level, so it needs two more things than a lake survey: a way to keep only the water, and a window, since the whole planet is 86,400 × 43,200 cells.
bathymetry.py does both. --bbox reads just a rectangle (in degrees), and --surface keeps only the cells lower
than the water's surface and joined to the deepest point, so a low valley next to the lake is not mistaken for
water. A copy of the 2024 grid is published as one cloud-optimised GeoTIFF on Source Cooperative, which can be read
over the web without downloading it:
python bathymetry.py \
  https://s3.us-west-2.amazonaws.com/us-west-2.opendata.source.coop/alexgleith/gebco-2024/GEBCO_2024.tif \
  baikal.png --surface 455 --bbox 103.5 51.3 110.2 55.95
# 716 x 900 px of 568.1 m (406.79 x 511.32 km), black = -1186.9, white = 455.0, 84% transparent
455 m is Baikal's water level; for a sea it would be --surface 0. The deepest cell is 1,642 m below the surface,
which matches the lake's published depth. The rectangle is 6.7° wide, so the script's reprojection to one UTM zone
stretches its ends a little; for a whole sea or an ocean, reproject in QGIS to a projection made for that area
first.
With the same settings as Crater Lake but a 300 mm map, it comes out 238 × 300 mm. Olkhon Island is the hole on the west shore, and the lake's three basins, south, middle (the deepest) and north, are the high ground:
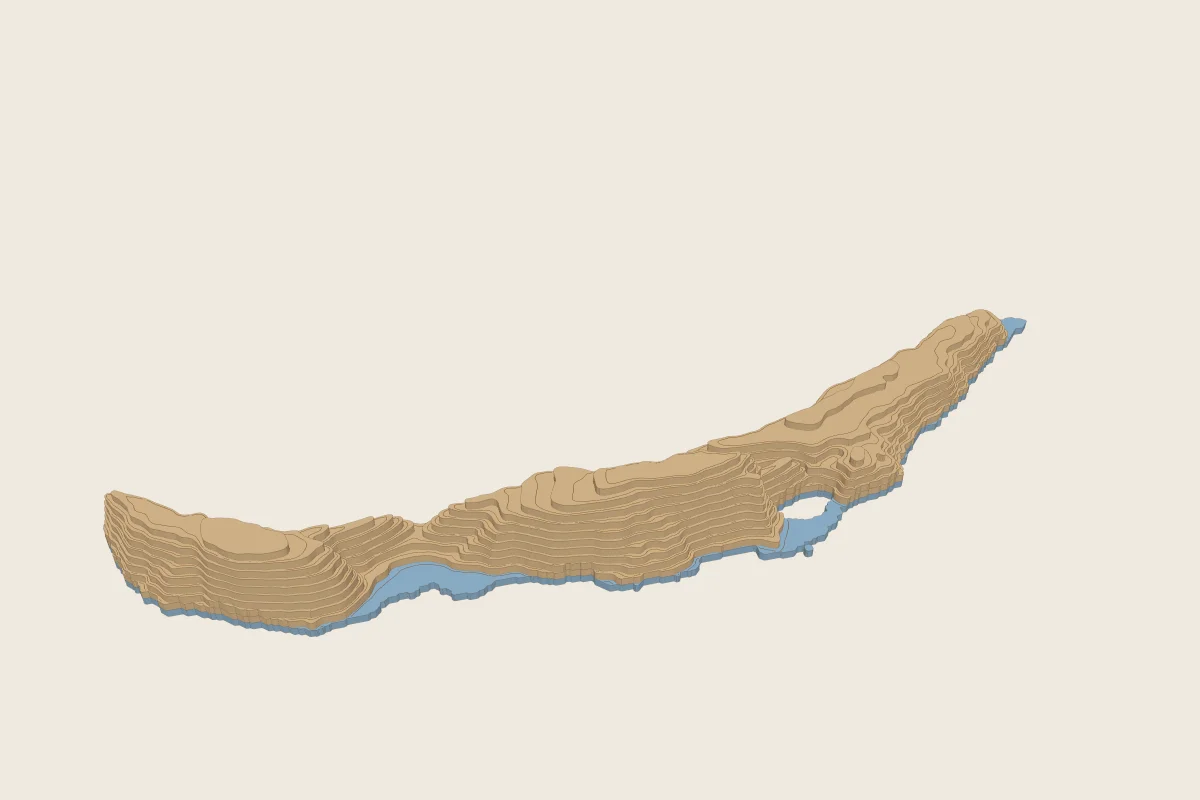
Note the exaggeration: on a map at 1:1,700,000, Baikal's 1,642 m would be 1 mm tall. The 30 mm cast is stretched 31 times. That is normal for big water: seas are thousands of times wider than they are deep, and every physical model of one exaggerates.
For a coast and its seabed rather than a cast, keep the land: run the script without --surface, leave Dark
is high off, and the generator cuts the land and the seabed as one terrain. The map then needs a lot of layers,
because the sea is usually much deeper than the land is high.
The basin version
To set a lake floor into the land around it, you need one heightmap with both: the survey where there is water, a land model (the free 30 m Copernicus model, see where to get a heightmap) everywhere else. In QGIS:
- Reproject both to the same UTM zone and the same pixel size (Raster > Projections > Warp).
- Merge them with the survey on top (Raster > Miscellaneous > Merge: the last file listed wins). Land models show a lake as its flat water surface, so the survey has to replace those cells.
- Export as a 16-bit PNG, black at the lowest and white at the highest point
(
gdal_translate -of PNG -ot UInt16 -scale MIN MAX 0 65535).
Then use the generator's defaults: no Dark is high, Shape rectangle. The Crater Lake basin above is 12.6 km across on 200 mm, from 1,289 m on the lake floor to 2,482 m on Hillman Peak, the highest point of the rim: 10 layers of 119 m, stretched 1.6 times. I engraved the shoreline on it from an SVG of the lake's outline (a stroked path is engraved as a single line), so you can still see where the water stood.
Tips
- Crater Lake is unusually deep for its size. Most lakes are shallow bowls: a lake 2 km across and 30 m deep is common. Exaggerate more (10 times or more), or use thinner sheets: 2 mm ply gives 50 % more layers for the same height.
- Shallow shelves disappear into the base. Water shallower than half a layer is in the base sheet. If the shape of the shallows matters (a reef, a sandbar), raise the relief or engrave contour lines with Contour lines per layer.
- Small islands become small holes, and tiny ones are filled in by Smallest feature. Lower it to keep a rock; raise it to fill in islands you don't want.
- Survey gaps are holes too. Sonar surveys often miss the shallowest strip along the shore, where the boat could not go. Look at the transparent area of the heightmap before you cut: if there is a ragged gap between the data and the real shore, fill it in QGIS (Fill nodata) before making the PNG.
Open the Relief map generator · Where to get a heightmap · A complete project: K2
Data credit and sources
Crater Lake bathymetry: Gardner, J.V., and Dartnell, P., 2001, 2000 Multibeam sonar survey of Crater Lake, Oregon:
data, GIS, images, and movies, U.S. Geological Survey Data Series 72,
doi:10.3133/ds72. Public domain; not for navigation.
crater-lake.png is made from it.
Lake Baikal: GEBCO Compilation Group (2024) GEBCO 2024 Grid (doi:10.5285/1c44ce99-0a0d-5f4f-e063-7086abc0ea0f), read from the copy on Source Cooperative. Not for navigation.
The Crater Lake basin picture uses Copernicus WorldDEM-30 for the land: © DLR e.V. 2010-2014 and © Airbus Defence and Space GmbH 2014-2018 provided under COPERNICUS by the European Union and ESA; all rights reserved. The organisations in charge of the Copernicus programme by law or by delegation do not incur any liability for any use of the Copernicus WorldDEM-30. laserpuzzle is not endorsed by the European Commission, ESA, DLR or Airbus.
Crater Lake's history: the National Park Service's Wizard Island and other post-caldera eruptions, the USGS overview of the 2000 survey and post-caldera volcanism.